
Statistics
Your figures, without opening a spreadsheet.
How many covers this month? Is Friday night really full? Are no-shows going down? The dashboard answers, and compares each period with the one before.
No credit card. When the trial ends, nothing is charged unless you choose a plan.
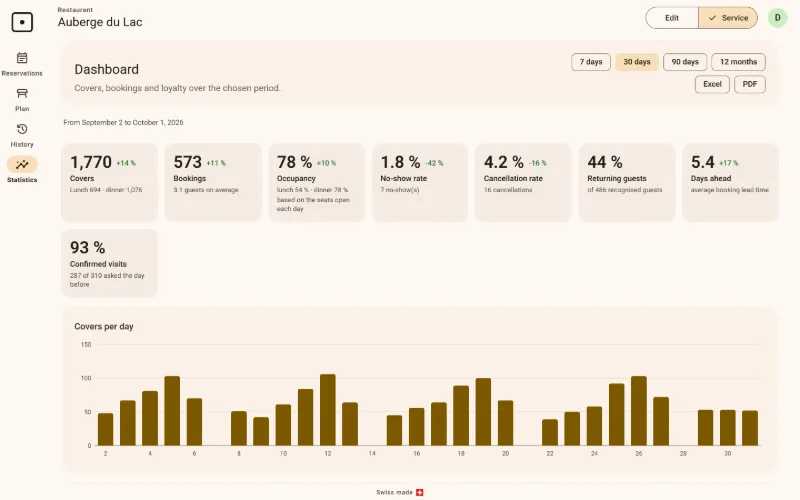
The essentials in eight figures
Lunch and dinner covers, bookings, occupancy worked out on the seats really open, no-show rate, cancellation rate, returning guests, average lead time and visits confirmed the day before.
- A closed or out-of-season room does not skew the occupancy
The right days, the right hours
Covers per day, average per weekday, arrival time: enough to plan staff and purchasing on what really happens in the room.
Over the period you care about
7, 30 or 90 days, 12 months or the dates you choose, exported to Excel or PDF in one click. The dashboard is for the restaurant's Ownership.
Plans Included in the Resto and Gastro plans. Compare the plans →
Screenshots taken in RESTO ONE with a made-up restaurant, the Auberge du Lac: the names and figures are invented.
Frequently asked questions
Are the figures in the screenshot real?
No: they are made up for an imaginary restaurant. In RESTO ONE, your restaurant's bookings produce them.